Panic! at the Party
A synthetic community platform in NetLogo, built to watch growth, churn, and hosting push on each other as one system.
I found this UX Design piece on simulation models in research. The idea is to watch an ecosystem play out instead of testing one variable at a time. So I tried it: build a platform, turn some knobs, see what happens.

The category I'm modelling: a dozen apps, all some version of the same thing, an event page and a crowd to fill it.
A city-scale Luma: ~100 users moving through six states (new, passive, active, host, inactive, churned), each with a topic interest (power-law, mostly mainstream), a social motive (homebody to butterfly), and a budget. Events spawn daily, some host-created, some platform-curated, lasting a day or two. Users find them by proximity, topic, motive, and price. Hosts emerge from steady attendance and last only while their events draw people, with burnout built into the model.
Yellow stars are events; dots are users colored by state. Orange is always the smallest population — and the most load-bearing.
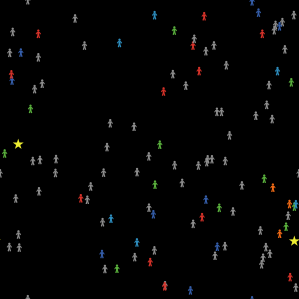
Day 50, healthy parameters. One orange host just emerged; most are still passive (gray) or churning (red), one event running. Alive, but not yet on fire.
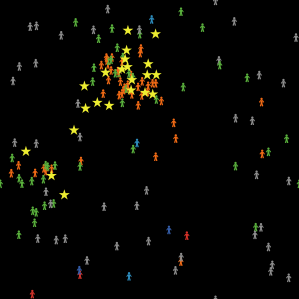
Day 110, same parameters. A dense host cluster has formed in one topic, drawing event stars and a green ring of regulars. That's what "alive" looks like: concentrated, clustered, sustained by a few hosts.
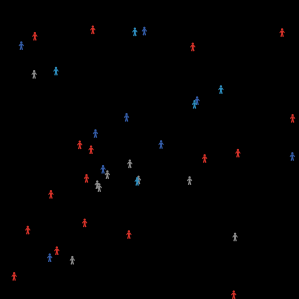
Day 220, adverse parameters (low event creation, fast decay, no notifications). It never built a host class — with no orange dots seeding events, the rest unravels into red churn and scattered survivors. Same model, different knobs, different fate.
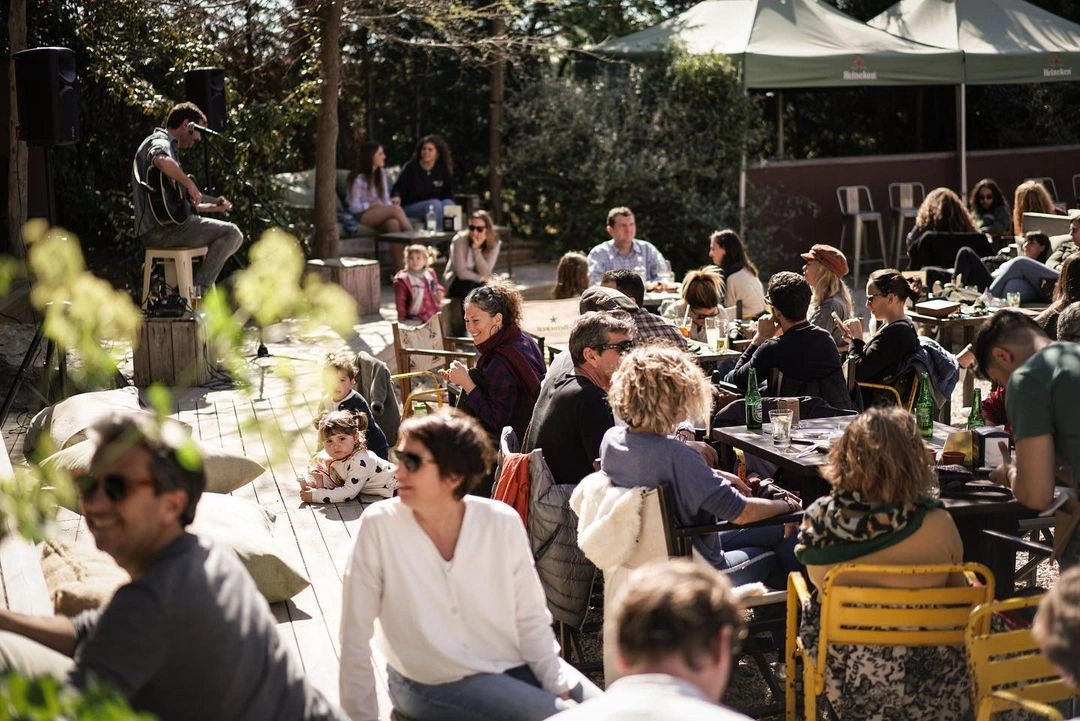
The real version of a healthy run: a crowd that turned up because someone made a thing to turn up to.
A few patterns kept showing up. Hosts are the load-bearing minority: lose one and it cascades through everyone who attended. Growth stresses communities rather than stabilising them. A referral spike floods the system, and if hosts can't absorb it, churn follows. The smallest topic dies first, not because it's small but because it can't sustain even one host. The decisions that matter aren't acquisition levers; they protect the few doing the actual work.

Easy to forget, staring at sliders, that this is the thing being modelled.
This isn't production research: it's uncalibrated, the defaults are educated rather than measured, the rates unvalidated. But I wasn't after prediction. I wanted to see causality as a shape instead of a list of factors. Looking at a community product now, I ask different questions: who's hosting, what happens when they stop, how long it absorbs a spike. The simulation didn't tell me what to design, but it changed what I look for.